
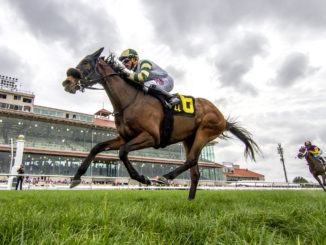
Two of my favorite race meetings open this week with Oaklawn Park lifting its lid on Friday and Sam Houston Race Park raising its curtain on Saturday. Also on Saturday are the first Grade 1 races this year when Gulfstream Park plays host to the Pegasus World Cup and World Cup Turf.
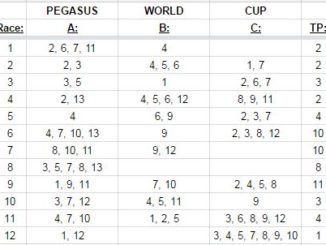
For handicapping reports, click each track’s name; for FREE Brisnet.com Ultimate Past Performances of Pegasus contenders, click the race names. For TwinSpires.com’s Oaklawn preview, CLICK HERE.
I’ve laid low on the wagering the past few weeks. In part in anticipation of two tracks I really like to play as well as a concern that I was experiencing some mix of tilt and burnout following a very good Keeneland meeting and Breeders’ Cup (bounce?).
Before I jump headfirst into the opening day card at Oaklawn led by the Ketucky Derby points race Smarty Jones Stakes, I wanted to study up on my wagering in 2018 and since 2014 (past 5 years).
Unfortunately, the year ended poorly. My pari-mutuel ROI in December was -49.4% (hence the yearning to take a break) to drop my 2018 ROI to -5.8%. I began tracking every pari-mutuel wager in 2010, and while I’m pleased to demonstrate some obvious growth the past few years, I’m disappointed I haven’t been able to make the next jump to breakeven or marginally profitable.
| Year: | ROI: | 2-year | 3-year | 4-year | 5-year |
| 2010 | -24.65% | ||||
| 2011 | -18.64% | -20.48% | |||
| 2012 | -5.76% | -11.61% | -13.79% | ||
| 2013 | -24.96% | -13.69% | -15.31% | -16.50% | |
| 2014 | -15.99% | -21.49% | -14.17% | -15.41% | -16.43% |
| 2015 | -7.54% | -10.72% | -16.04% | -12.47% | -13.85% |
| 2016 | -1.81% | -3.84% | -5.99% | -10.13% | -9.09% |
| 2017 | -3.44% | -2.77% | -3.65% | -4.89% | -7.65% |
| 2018 | -5.82% | -4.75% | -4.04% | -4.45% | -5.21% |
Below is my pari-mutuel ROI by month since 2010 (i.e. 9 Januarys, 9 Februarys … 9 Decembers).
| Month: | ROI: | Market: |
| January | -15.27% | 8.58% |
| February | -22.00% | 9.70% |
| March | 35.91% | 10.54% |
| April | -20.13% | 10.24% |
| May | -21.73% | 13.79% |
| June | -18.37% | 10.65% |
| July | -14.94% | 9.08% |
| August | -17.76% | 8.76% |
| September | -11.32% | 10.62% |
| October | 28.24% | 13.85% |
| November | -12.00% | 17.34% |
| December | -27.30% | 8.32% |
If we take November-February out of the equation, my ROI the past 9 years goes from a “at least I beat the takeout” -8.5% to a very respectable -4%. And if we limit it to just the past 4 years, then we have a +0.5% ROI March-October (2015-2018). Hey, that’s not bad!
Of course, anyone who’s played the volume I have for as long as I have could gerrymander his/her numbers to find some brightspots, and while I’ll stop short of saying I’m proud of mine, I will say I hope the light they provide can overcome the shadow of being a long-term loser. It’s a new year, and we’re going to make the best of it.
Before I get to the other bright spot, I want to close the book on pari-mutuel discussion by looking at my record by track over the past 5 years. The first chart represents the 15 tracks that received at least 2% of my total handle over that time
| TRACK: | ROI: | Market: |
| Churchill Downs | -26.24% | 14.51% |
| Keeneland | 12.39% | 8.37% |
| Gulfstream | -24.91% | 5.53% |
| Mahoning Valley | -23.21% | 4.94% |
| Saratoga Tbd | -22.70% | 4.15% |
| Belmont Park | -47.01% | 3.93% |
| Turfway Park | -24.68% | 3.54% |
| Fair Grounds | -5.30% | 3.43% |
| Aqueduct | -25.45% | 3.33% |
| Oaklawn Park | -18.13% | 3.24% |
| Arlington | -24.07% | 2.92% |
| Santa Anita | -28.79% | 2.81% |
| Indiana Downs | -57.48% | 2.79% |
| Sam Houston | 132.79% | 2.72% |
| Woodbine Tbd | -23.09% | 2.35% |
No surprise that Churchill Downs tops the list in terms of my handle and on an average handle per day basis, Keeneland is probably right there with the mothership. On the plus side, I take some pride in beating Keeneland over a 5-year (10-meeting sample), but on the other hand that Churchill number is dastardly.
My excuse is that I am not good at betting on the Big Events. Look at the Belmont ROI, which is even worse, and Pimlico didn’t make the 2%+ cut, but my ROI there is similarly bad at -46%, and almost all that action is Preakness week.
There were 41 tracks that attracted at least 0.40% of my wagering dollars the past 5 years, and I showed a profit on 10 of them with Sam Houston and Keeneland leading the way among handle leaders, and Parx and Kentucky Downs making good showings as well.
| TRACK: | ROI: | Market: |
| Sam Houston | 132.79% | 2.72% |
| Parx Racing | 48.46% | 1.35% |
| Kentucky Downs | 38.30% | 1.11% |
| Prairie Meadows | 30.90% | 0.42% |
| Portland Meadows | 18.23% | 1.00% |
| Keeneland | 12.39% | 8.37% |
| Finger Lakes | 11.77% | 1.22% |
| Belterra Park | 8.85% | 0.47% |
| Presque Isle | 7.10% | 0.47% |
| Fort Erie | 6.04% | 1.18% |
On the negative side, Breeders’ Cup has been particularly heinous, and I just straight up need to stay away from Laurel, Remington, Mountaineer, and Indiana Downs. 0.40% might not seem like a lot, but let’s just say those are not insignificant raw dollars.
| TRACK: | ROI: | Market: |
| Laurel Park | -95.85% | 0.40% |
| Remington | -86.29% | 0.44% |
| Breeders Cup Fri | -74.19% | 0.51% |
| Mountaineer | -70.01% | 0.41% |
| Indiana Downs | -57.48% | 2.79% |
| Breeders Cup Sat | -49.59% | 0.74% |
| Belmont Park | -47.01% | 3.93% |
| Pimlico | -46.13% | 1.58% |
| Delta Downs | -42.80% | 1.11% |
| Delaware Park | -39.56% | 0.92% |
The last thing I want to talk about is contest play. I’ve never included it before in my year-end wrap because I had viewed it as a sort of action fun wager, but I really got into it this year and devoted enough time to playing in them and the theory behind excelling in them that I’m definitely going to make it a part of my wagering arsenal this year as bankroll allows.
My ROI in contest play was +2.5%. Obviously, I’m thrilled to be in the black in that environment, but as my contest handle was just 30% of my total handle for the year (pari-mutuel + contest), my overall ROI still gets the “-” at -3.3%.
Admittedly, I got really hot in the Saratoga contests, and that pretty much carried a year in which I was profitable in just 4 of the 12 months, so I’m eager to see if that was an aberration or just the nature of the ebbs and flows of trying to be profitable in the contest space.

Your results are very impressive, especially given the volume and breadth of tracks.
Your detailed documentation is even more impressive … stunning really. Most handicappers/bettors have myriad ways to fool themselves … and faulty accounting chief among them.
When I was teaching handicapping courses, I would tell the students that the path to break-even was similar to MLB batting averages … you had to be a .300 hitter to have a chance. If you batted in the .200’s, you’d better hit a lot of home runs (long-shots).
Have you ever recorded your win % by track or year?
If you get this, please respond to liberationfarm@yahoo.com